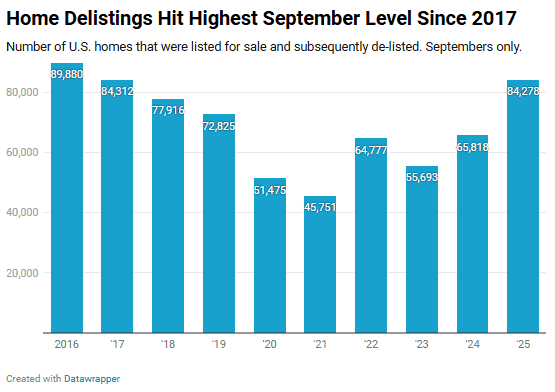
Количество домов, снятых с продажи, в сентябре достигло исторического максимума
По данным общенационального анализа исторических данных о листинге, проведенного компанией Redfin, в сентябре почти 85 000 домовладельцев в США сняли с рынка свою недвижимость, что на 281 трлн больше, чем годом ранее, и является самым высоким показателем за месяц с 2017 года. Компания проанализировала тенденции делистинга с 2016 года, определив делистинг как любой объект недвижимости, который оставался вне рынка более 31 дня без продажи или заключения договора.
Данные свидетельствуют о растущей тенденции к уходу продавцов с остывающего рынка жилья, характеризующегося ростом ипотечных ставок, снижением спроса и увеличением запасов. В сентябре также наблюдалась необычайно высокая доля «замороженных» предложений: домов, которые находились на рынке не менее 60 дней, но не нашли покупателя. По данным Redfin, примерно 70% активных предложений в США достигли этого порога, а типичный снятый с рынка дом оставался непроданным около 100 дней.
Многолетний рост числа исключений из листинга
Хотя число делистингов обычно растёт зимой, сентябрьский всплеск вписывается в более общую тенденцию: продавцы сокращают количество заявок на выкуп недвижимости всё быстрее уже 18 месяцев подряд. В годовом исчислении пик делистинга пришёлся на июнь — 39%. Аналогичная волна наблюдалась в 2022 году, вскоре после того, как стоимость заимствований резко выросла с минимумов, зафиксированных во время пандемии.
Почему продавцы отступают
Агенты и экономисты называют несколько причин отступления:
Спрос застопорился. Высокие ставки по ипотеке, рекордные цены на жилье и всеобщая экономическая неопределенность, включая неуверенность потребителей, связанную с закрытием федерального правительства, оказали влияние на активность покупателей.
Нежелание терпеть убытки. Около 15% домов, исключенных из листинга в сентябре, были выставлены на продажу по цене не более чем на 10% выше первоначальной цены покупки их владельцев, что создавало риск их продажи с убытком.
Запасной вариант аренды. Все больше потенциальных продавцов предпочитают сдавать свою недвижимость в аренду, а не соглашаться на более низкие предложения.
В целом предложение увеличилось. Количество активных заявок выросло на 8% в сентябре по сравнению с аналогичным периодом прошлого года, что является самым высоким показателем для этого месяца с 2019 года; увеличение количества товаров на складе, естественно, привело к увеличению числа отказов.
«Все больше продавцов отказываются от покупки, поскольку их дома долгое время находятся на рынке, и они не хотят — или не могут себе позволить — соглашаться на более низкую цену», — говорит Асад Хан, старший экономист Redfin.
Делистинги теперь занимают большую долю рынка
В сентябре изъятия составили 5,5% от всех предложений жилья в США, что является самым высоким показателем за месяц в базе данных Redfin и превышает показатель в 4,8% годом ранее. Этот рост подчёркивает, насколько многие продавцы недовольны текущей рыночной конъюнктурой, несмотря на рост запасов.
Откаты поддерживают цены
Фундаментальные показатели указывают на понижательное ценовое давление: число активных заявок растет, число подписанных контрактов сократилось на 21 процентный пункт за три тысячи, но общенациональные цены на жилье в сентябре все же выросли примерно на 21 процентный пункт за три тысячи по сравнению с прошлым годом. Экономисты отмечают, что массовые делистинги способствуют поддержанию цен, сохраняя предложение более ограниченным, чем предполагают исходные данные о запасах.
«Когда десятки тысяч продавцов отказываются от предложений, не принимая их ниже своих ожиданий, фактическое предложение для потенциальных покупателей сокращается», — сказал Хан.
Многие домовладельцы изначально не выставляют недвижимость на продажу. Количество новых предложений остаётся неизменным, поскольку владельцы, у которых низкие ставки по ипотеке в период пандемии, оценивают, стоит ли продавать недвижимость сегодня.
«Сейчас уже не лучшее время для продажи», — сказала Адити Джайн, агент Redfin Premier в Бостоне. «Большинство объектов недвижимости теперь получают одно-два предложения вместо десяти. Если продавцы не получают желаемого количества, они предпочитают подождать год-два или сдать недвижимость в аренду».
Каждое пятое исключение из листинга возвращается
Снятие с листинга часто используется как стратегия, а не как способ выхода. Около 20% домов, снятых с торгов в июле, и 18% домов, снятых с торгов в июне, вернулись на рынок в течение трёх месяцев, часто по пересмотренным ценам. Примерно треть домов, выставленных на повторный аукцион в июле, с тех пор были проданы.
Недавние покупатели чаще всего делают исключения
Почти половина домов, снятых с торгов в сентябре, принадлежала покупателям, которые приобрели недвижимость в течение последних пяти лет. Вероятность снятия с торгов этой группой непропорционально высока: только 37% всех активных объявлений по всей стране принадлежат таким недавним покупателям.
Покупатели жилья в период пандемии часто имеют ставки по ипотеке ниже 3% и всё ещё ожидают ценовых войн, подобных тем, что были в 2021 году, говорят экономисты. Многие тестируют рынок, а не переезжают. В отличие от этого, владельцы жилья, проживающие в нём долгое время, — с большим капиталом и более чёткими сроками переезда — как правило, более мотивированы на продажу.
Где резко возросло число делистингов
Среди 50 крупнейших мегаполисов страны в сентябре:
Наибольший годовой прирост: Вирджиния-Бич (+74,5%), Вашингтон, округ Колумбия (+53,9%), Сан-Хосе (+53,3%), Даллас (+52,1%) и Хьюстон (+49,6%).
Где отказались от делистинга: Сент-Луис (-12,4%), округ Нассау, штат Нью-Йорк (-7,2%) и Чикаго (-1%).
Наибольшая доля исключений из листинга: Майами (7,8%), за которым следуют Форт-Лодердейл, Даллас, Филадельфия и Уэст-Палм-Бич (все около 7,5%).
Самая низкая доля: Питтсбург (3.4%), Милуоки (3.5%), Колумбус (3.6%), Цинциннати (3.7%) и Чикаго (4.1%).
Наиболее устаревшие списки: Майами и Форт-Лодердейл (оба 84,6%), Остин (82,8%), Уэст-Палм-Бич (82%) и Сан-Антонио (81,2%).
Наименее устаревший: Сан-Хосе (44.2%), Сан-Франциско (45.9%), Бостон (48.9%), Провиденс (49.1%) и Милуоки (49.2%).
