С 29 мая мы наблюдаем снижение доходности 10-летних облигаций, что благоприятно для рынка. ставки по ипотечным кредитам. Критический вопрос: сможет ли эта тенденция сохраниться? Данные недавнего заседания ФРС и смягчающиеся данные по инфляции намекают на потенциальное продолжение – если данные по труду станут мягче. Как это влияет на еженедельные данные по жилью? Давайте углубимся в детали и узнаем.
Доходность по 10-летним облигациям и ставки по ипотечным кредитам
После интенсивного данные недели вакансий, мы перешли прямо к неделе инфляции CPI и PPI, к которой приурочено заседание ФРС! Я получил один положительный момент от заседания ФРС, который заставил меня улыбнуться: Пауэлл наконец признал, что рынок труда больше не является напряженным, что является выгодным заявлением для ставок в будущем, если данные по труду станут слабее. Я обсуждаю это в этот эпизод принадлежащий Подкаст HousingWire Daily.
На прошлой неделе были более мягкие данные по инфляции, но я думаю, что гораздо больше внимания необходимо уделить еженедельным данным по заявкам на пособие по безработице и данным недели занятости.
Доходность 10-летних облигаций закрылась на прошлой неделе на уровне 4,22%.
Ипотечные спреды
Разница между ставкой по 30-летним ипотечным кредитам и доходностью по 10-летним облигациям является проблемой с 2022 года, а после мартовского 2023 года ситуация ухудшилась. банковский кризис. Однако в этом году спреды улучшились, несмотря на то, что они далеки от обычных.
Если бы мы взяли худшие уровни спредов 2023 года и включили их сегодня, ставки по ипотечным кредитам были бы 0.52% выше. Хотя мы далеки от средних показателей по спредам, тот факт, что мы наблюдаем такое улучшение, является плюсом в этом году.
Данные заявки на покупку
На прошлой неделе у нас был второй лучший результат по еженедельным данным по заявкам на покупку в процентах, поскольку ставки по ипотечным кредитам недавно упали. Теперь предупреждаю всех, что мы работаем с неглубокой планки, поэтому перемещение иглы не займет много времени. Однако у вас есть кое-что, если мы сможем продержаться вот так несколько недель.
С ноября 2023 года, когда ставки по ипотеке начал падать, еженедельно у нас было 13 положительных отпечатков против 13 негативных и двух плоских отпечатков. Когда в 2024 году ставки по ипотечным кредитам начали расти, некоторый спрос снизился. Как показано ниже, данные с начала года даже не являются положительными для 2024 года: у нас было семь положительных отпечатков, 13 отрицательных отпечатков и два плоских отпечатка. При таких высоких ставках мы не наблюдаем реального роста спроса на ипотеку, а отскоки, которые мы видим в данных, происходят от депрессивных уровней.
Еженедельные данные инвентаризации жилья
В преддверии лета я все еще не могу выразить достаточно благодарности за рост инвентарь в этом году. Если ставки по ипотечным кредитам продолжат падать, а спрос возрастет, у нас будет гораздо лучший буфер с активными запасами, чем в 2022 и 2023 годах.
Мое практическое правило заключалось в том, что на инвентаре должно быть несколько еженедельных отпечатков в диапазоне 11 000–17 000, пока ставки выше 7,25%. В этом году мы сталкивались с этим трижды; в прошлом году был колоссальный ноль. Несмотря на то, что еженедельные темпы роста запасов не достигли этого уровня, в пятницу ставки упали, а запасы выросли на здоровом уровне. 8,943.
- Еженедельное изменение запасов (7–14 июня): запасы выросли с 611,596 к 620,539
- На той же неделе прошлого года (9–16 июня): запасы выросли с 443,749 к 451,808
- В 2022 году рекордное дно запасов составило 240,194
- На этой неделе ожидается пик запасов за 2024 год. 620,539
- В некотором контексте активные объявления на этой неделе в 2015 году были 1,174 446
Данные о новых объявлениях
Еще одним позитивным моментом в 2024 году стало то, что данные о новых объектах недвижимости растут с рекордно низкого уровня, который мы наблюдали в 2023 году. Поскольку большинство продавцов являются покупателями, то, что больше продавцов выставляют на продажу свои дома, было хорошо. Единственное, что касалось 2024 года, это то, что я был 100% уверен, что мы увидим сезонный пик продаж на уровне как минимум 80 000, и все больше и больше становится похоже, что этого не произойдет в этом году, поскольку сезонное снижение количества новых объявлений не за горами. прочь.
Вот новые объявления за последнюю неделю за последние несколько лет:
- 2024 71,457
- 2023: 62,187
- 2022: 87,996
Процент снижения цены
В среднем за год треть всех домов снимают снижение цен — это стандартная жилищная деятельность. Когда ставки по ипотечным кредитам растут, спрос падает, а процент снижения цен растет. Когда ставки падают и спрос улучшается, процент снижения цен может упасть. Эта линия данных носит сезонный характер, и с конца марта мы наблюдаем стабильный процент снижения цен в годовом исчислении.
По мере поступления старых устаревших данных мы должны увидеть замедление роста цен в годовом исчислении. Недавно я обсуждал это в подкаст HousingWire Daily и объяснил, почему я считаю, что это так. Вот проценты снижения цен за последнюю неделю по сравнению с предыдущими несколькими годами:
- 2024: 36%
- 2023: 31%
- 2022: 27%
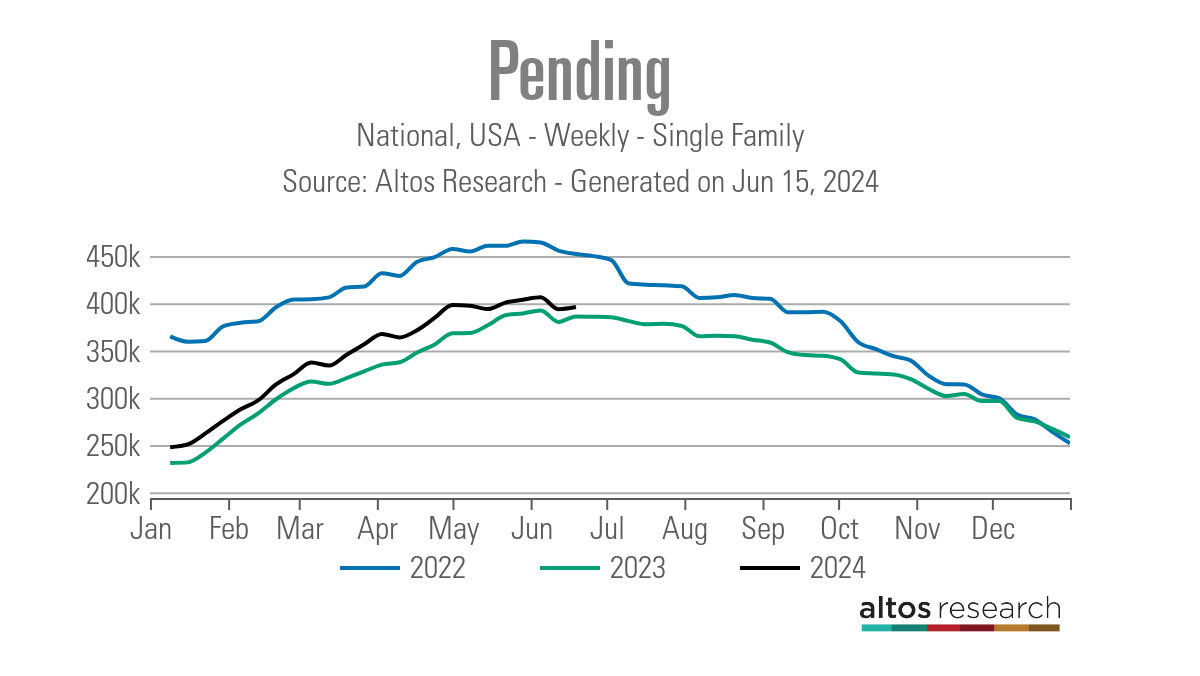
Ожидающие продажи
Ниже приведены наши еженедельные данные по незавершенным контрактам в годовом исчислении, показывающие спрос в режиме реального времени. Поскольку больше продавцов являются покупателями, в этом году у нас немного больше спроса. Если ставки по ипотечным кредитам снизятся и останутся на низком уровне, данные по этим контрактам будут расти, но мы пока не видим такого роста спроса на ипотеку.
- 2024: 395,960
- 2023: 386,052
- 2022: 452,003
Предстоящая неделя: продажи существующего жилья, строительство новых домов, розничные продажи и выступления ФРС
На этой неделе мы получим некоторые экономические данные; розничные продажи будут важным источником данных для ФРС. Мы также начнем строительство жилья, и будет интересно посмотреть, продолжим ли мы тенденцию к снижению количества разрешений на одну и несколько семей. В пятницу будут опубликованы данные о продажах жилья на вторичном рынке, и они по-прежнему будут приближаться к недавним минимумам. Однако на этой неделе в выступлениях ФРС будут использованы все данные, которые мы собрали
